
Introduction
When you watch an offensive rush in hockey, do you ever wonder about the numbers behind it? For example, is the number of shots that were preceded by passes repeatable over an entire season? What about shooting percentages? If repeatable, do zones of the primary pass (the pass preceding a shot) influence this repeatability? What about rebounds and rebound shooting percentages (the goals scored from rebounds)?
Terminology
In hockey, “odd-man rushes” is a term frequently used to refer to offensive attacks such as the above where the attacking team has more players than the defending team. In my analysis, I will be slightly deviating from this jargon and instead use “odd-player rushes”, which consist of shots that were preceded by passes and taken on breakaways, 2-on-1, 3-on-2, etc. Any shots that are not rush shots with a player advantage are categorized as all_other_shots.
In the later parts of this analysis, I will be using the terms, “rebound shot” and “rebound shooting percentage”. The first indicates a shot on goal following a rebound and the second is calculated as rebound goals (goals that follow rebounds) divided by rebound shots.
Data
To investigate these questions, I will be using the Passing Project Data from the 2015~2018 NHL seasons organized by Ryan Stimson and Corey Sznajder. The data was collected by a group of volunteers who tracked every pass leading to a shot. According to Ryan’s MIT Sloan Sports Analytics Conference paper, “Each tracker was required to complete 2 - 3 training games for validation by the project leader to ensure consistency in classification of passes and recording of data. Occasional spot-checking of games was also conducted.”
There are 44 variables and over 150,000 observations in this dataset. Some notable metrics that I will be using for my analysis include shot_on_goal (1 for yes and 0 for no), goal (1 for yes and 0 for no), odd_man (number of players involved in player advantages during rushes), shooting_percentage (number of goals / number of shots on goals), shot_type (one-timer, slap shot, wrist/snap shot, backhand, etc), a1_zone (zone that the primary assist originated), and rebound_shot_on_goal (if a rebound occured and resulted in a shot on goal).
Many researchers have used this dataset to explore interesting research topics in hockey. For example, Ryan Stimson’s paper discusses repeatability of certain metrics on a team level and player level. Among other analysis, this NHL Numbers post covers repeatability of passes that crosses through the royal road (the line that goes directly through the middle of the ice from one net to the other) and provides visualizations.
In this analysis, I will look at repeatability of shots that were preceded by passes and taken during rushes with player advantages, shooting percentages, rebound shots, and rebound shooting percentages in 5v5 situations.
Methods
My main analysis tools are scatterplots and linear regression lines. I use linear regression to examine the relationship between first-half statistics (x-axis on all plots below) and second-half statistics (y-axis on all plots below) within the same seasons at the team level. To do this, I split each of the 2015-16, 2016-17, and 2017-18 seasons into first-half (before Jan 1st) and second-half (after Jan 1st) and then calculated the quantities of interest at the team level within each half-season. I then matched up the team statistics from each half-season with its counterpart (e.g. Vancouver’s 2016-17 first-half statistics with Vancouver’s 2016-17 second-half statistics).
I utilized Hadley Wickham’s ggplot2 package, a “system declaratively creating graphics, based on The Grammar of Graphics” to plot this information on a scatterplot and layered the regression line on each graph. I included 95% confidence bands, which provide a confidence interval on the slope of the regression line. In other words, we are 95% confident that the true regression line falls within the confidence bands, given the data we observed.
- If I can draw a horizontal line completely within the confidence bands, this means there exists a regression line with a slope of 0 within the 95% confidence band. This indicates that there is no significant relationship between the x-variable and the y-variable.
- If I cannot draw a horizontal line completely within the confidence bands, this means that a regression line with a slope of 0 falls outside the 95% confidence band. In other words, there is a significant relationship between the x-variable and the y-variable.
In each of the graphs below, there are three logos of each team, corresponding to each of the three seasons in the data. In terms of the linear regression graphs, the x-variable is a statistic from the first half of the season and the y-variable is a statistic from the second half of the season. As a result, we are really examining the relationship between the past and future of a statistic, or the repeatability of a statistic.
Repeatability of Odd-Man Rush Shots
- Shots that were preceded by passes and taken on odd player rushes are not repeatable over a season; this signifies that the number of odd-player rush shots per game in the first half is not a good predictor of the number of odd-player rush shots per game in the second half.
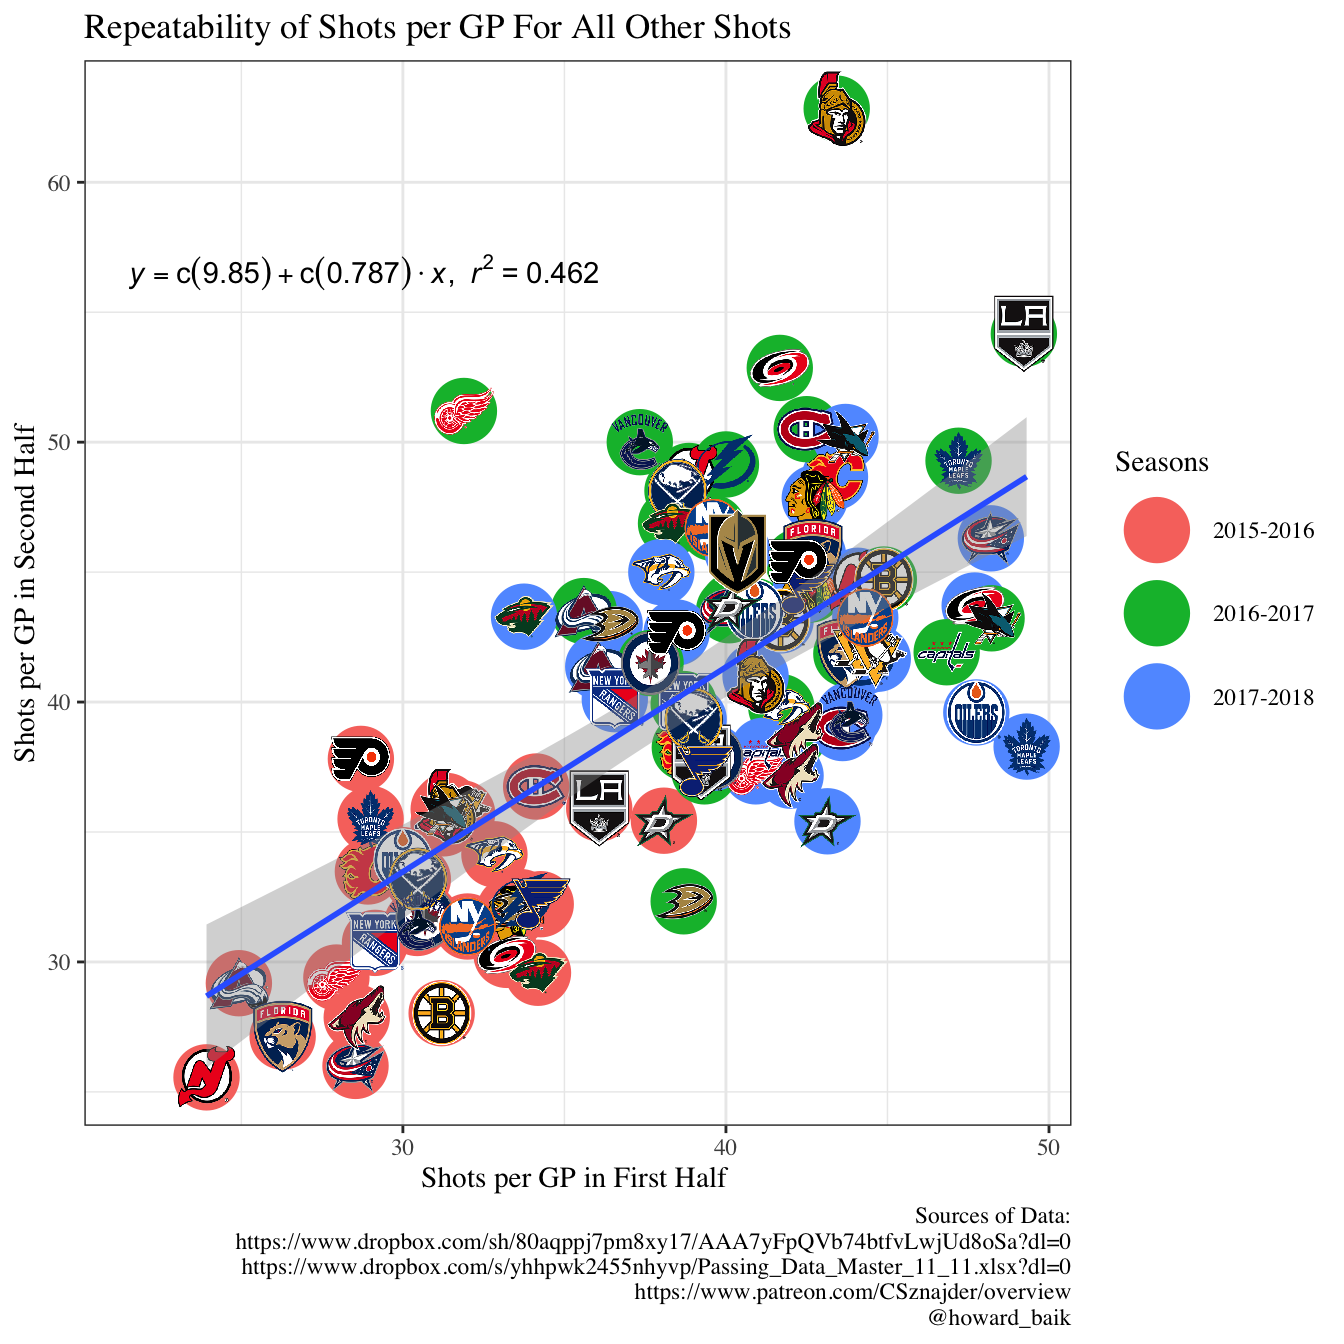
- However, all other shots that were preceded by passes are repeatable, meaning that the number of shots per game in the first half is a good predictor of the number of shots per game in the second half.
These findings suggest that hockey management and coaches must not read too much into the (lack of) offensive opportunities during odd player rushes in the first half; the second half presents a whole new playing field for players when it comes to odd player rushes.
Repeatability of Shooting Percentage
The below analysis on shooting percentages is parallel to the argument presented by Adam Gretz in “The roller coaster world of NHL shooting percentages”. Gretz opens the article with this statement: “A player’s shooting percentage in a given season has more to do with his luck as a shooter than his skill or the way he’s actually playing.” Furthermore, he claims, “They’re a wild roller coaster ride from year to year (and even during the season) that are always going up and down.”
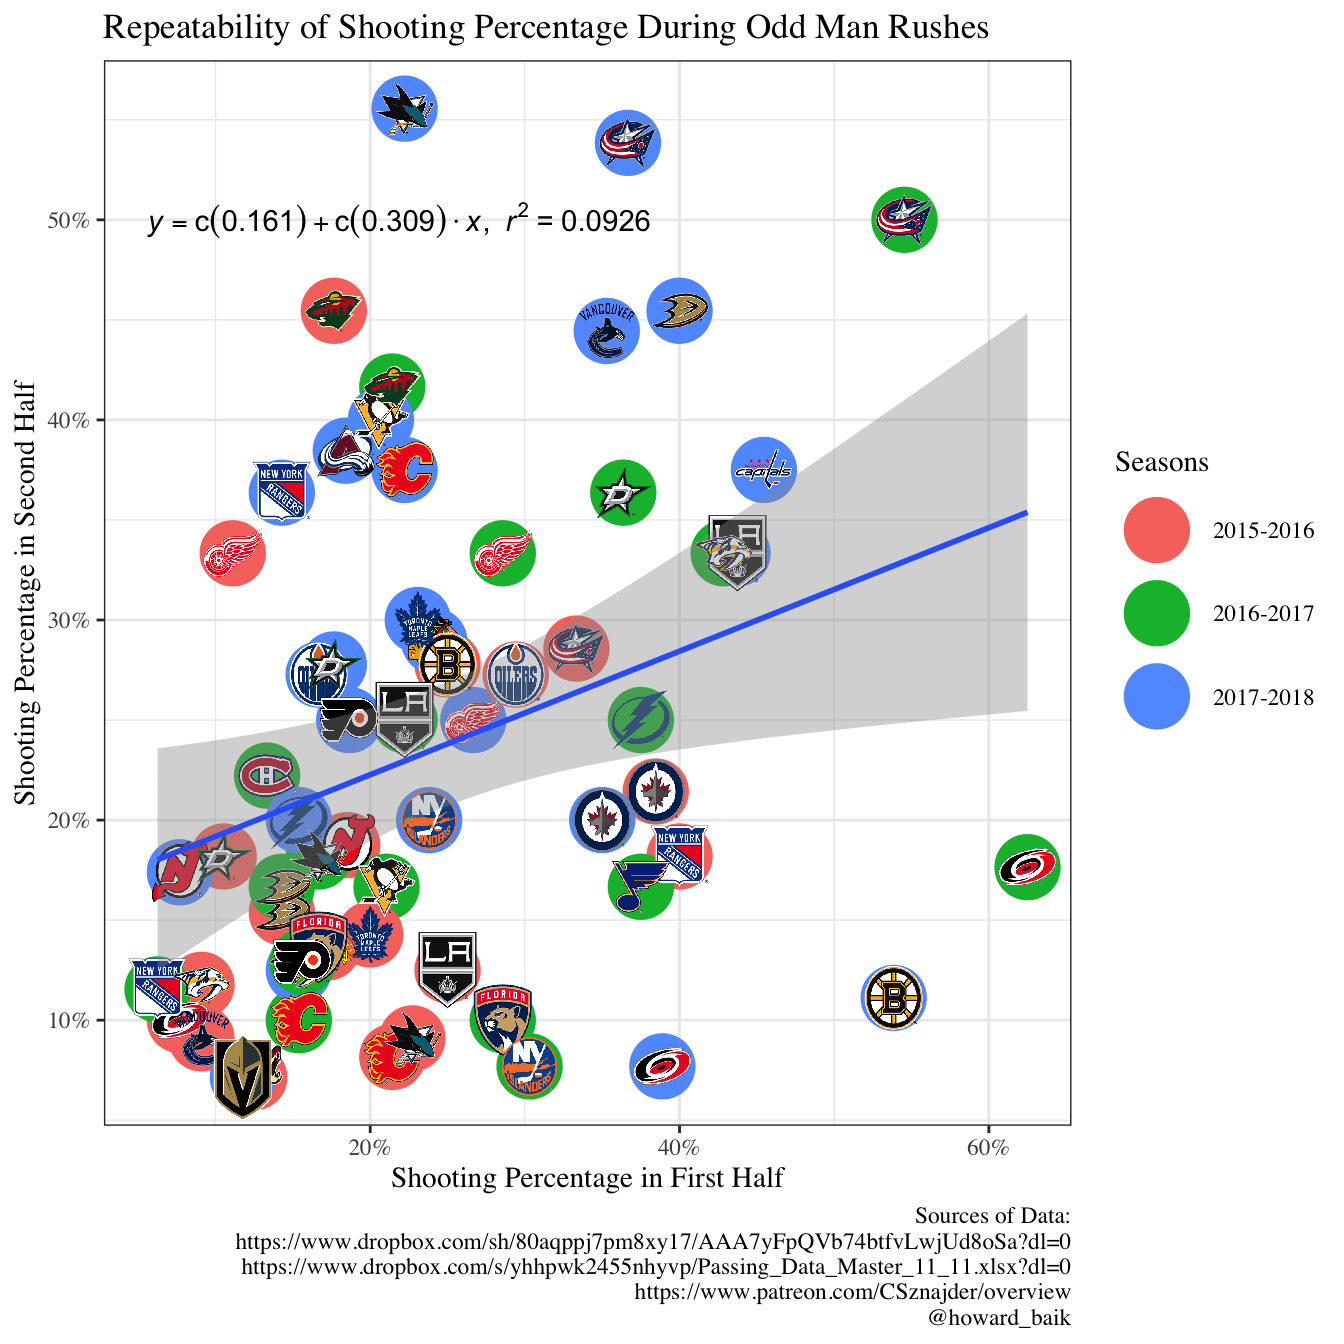
- The scales for the two facetted graphs are vastly different: shooting percentages across the whole season are significantly higher in odd player rushes than all other shots. This discrepancy makes sense when we consider the offensive freedom players have during odd player rushes.
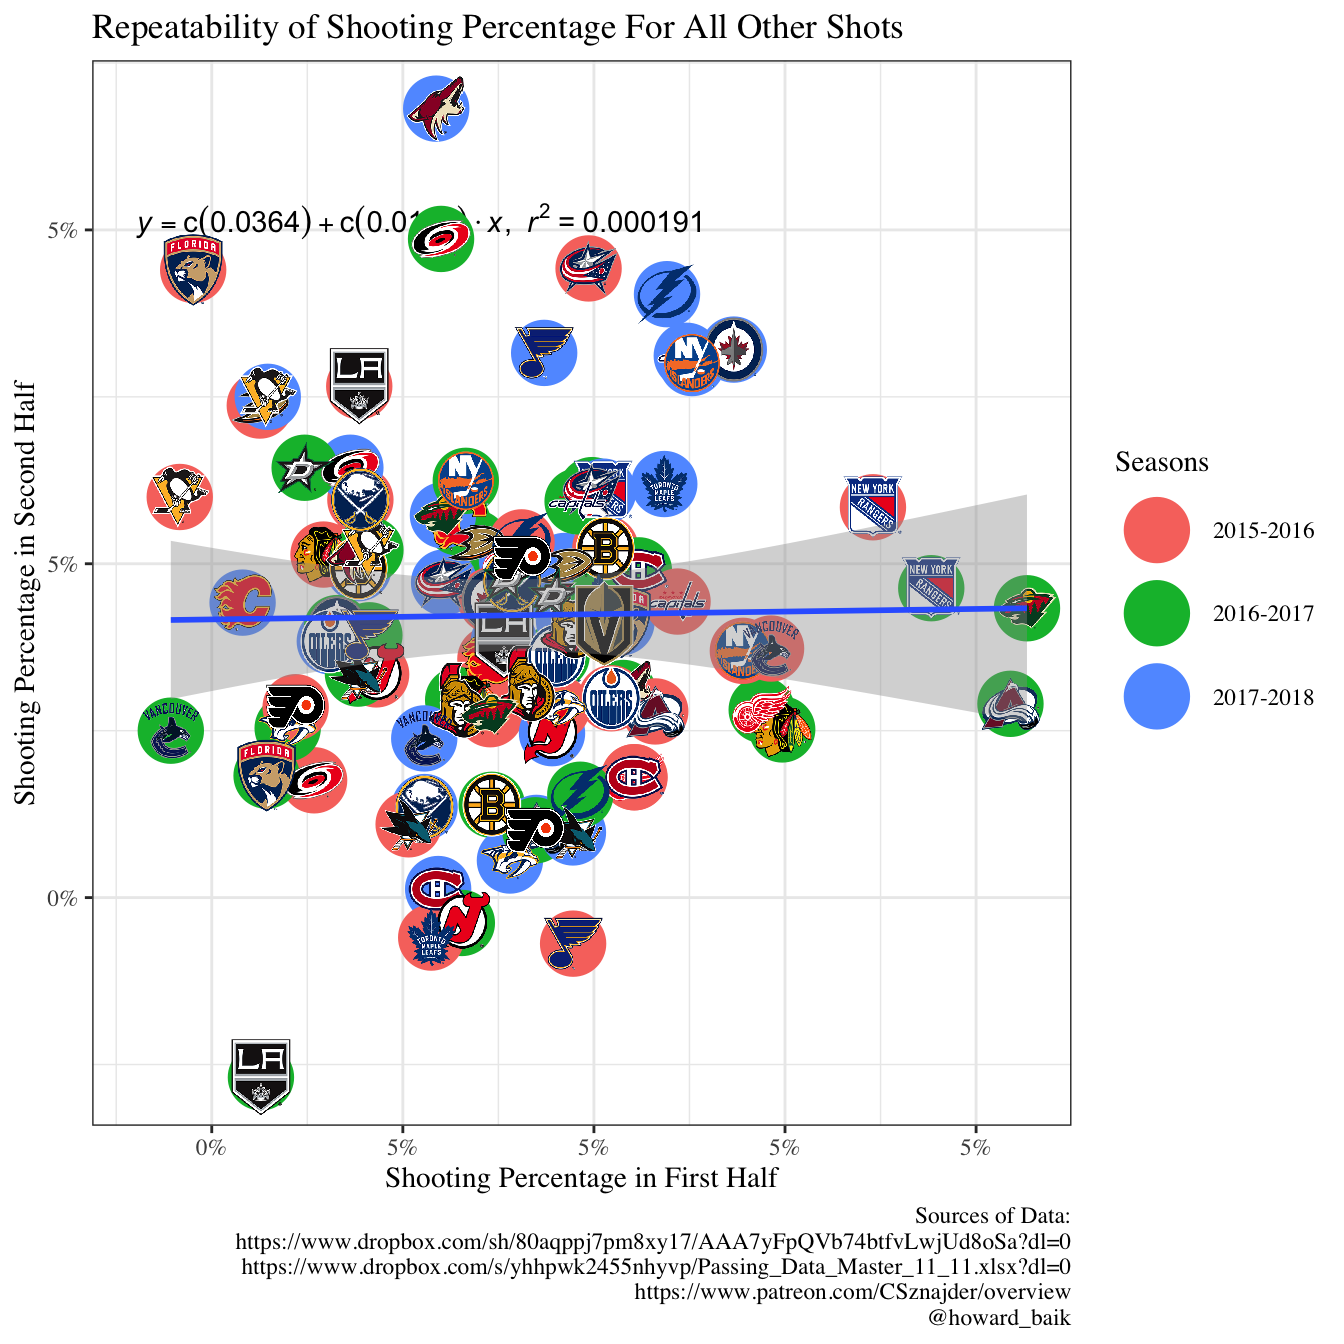
- Unlike shots per game played, shooting percentages for all other shots are not repeatable over a season.
- Like shots per game played, shooting percentages are not repeatable during odd player rushes, which means that teams that have had extremely low shooting perentages in the first half may not have a similar second half. On the other hand, teams with extremely high shooting percentages in the first half may not enjoy this in the second half!
These results confirm Gretz’s argument: “You just can’t count on a player to repeat or maintain a consistent shooting percentage, especially one that’s extremely high or, on the other end of the spectrum, extremely low.”
Repeatability of Shooting Percentages by Zone of Primary Pass

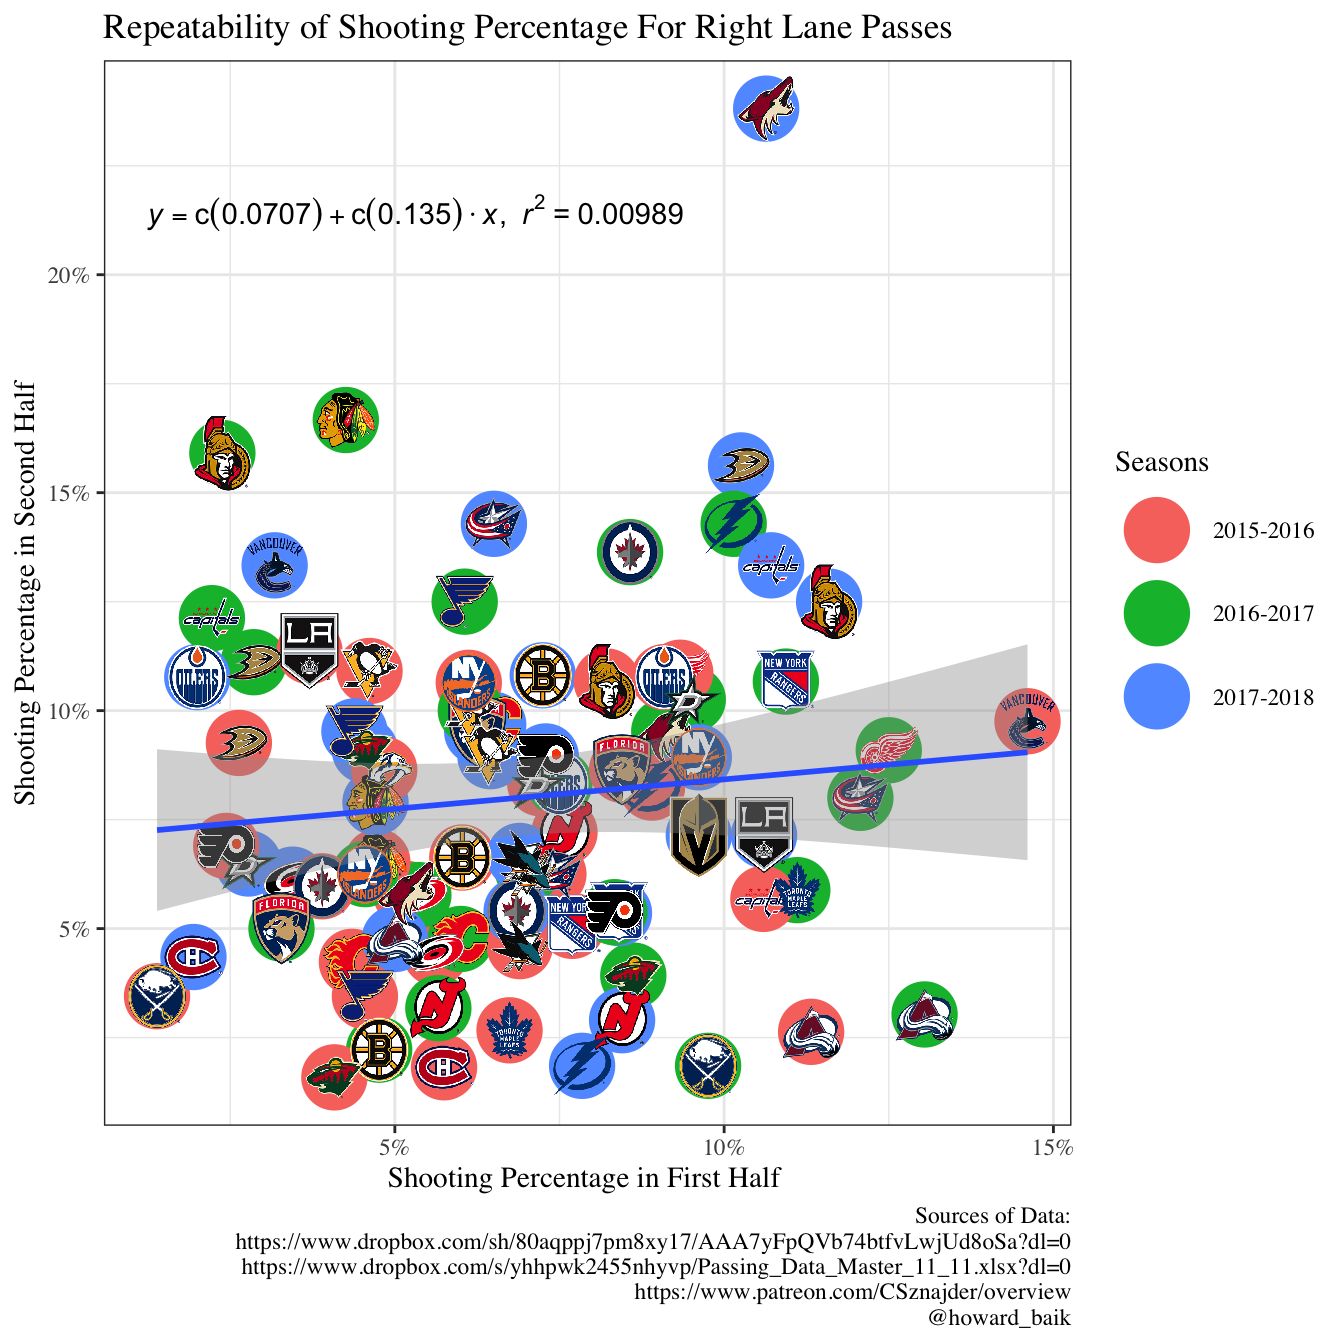

- None of these graphs show any signs of repeatability since I can draw a horizontal line through all these graphs.
- Thus, the lane of a primary pass does not help explain the discrepancy in repeatability of shooting percentages.
This tells us that set plays are not going to yield consistent results. For example, a premeditated faceoff play, which involves a primary pass from the same lane everytime, is not going to yield the same proportion of goals from the first half to the second half.
Repeatability of Rebound Shots per GP
Hockey literature reveals that “goalies generally do not have an ability to control rebounds” (Pettapiece, 2018). This accounts for the unpredictability of rebounds over a season.
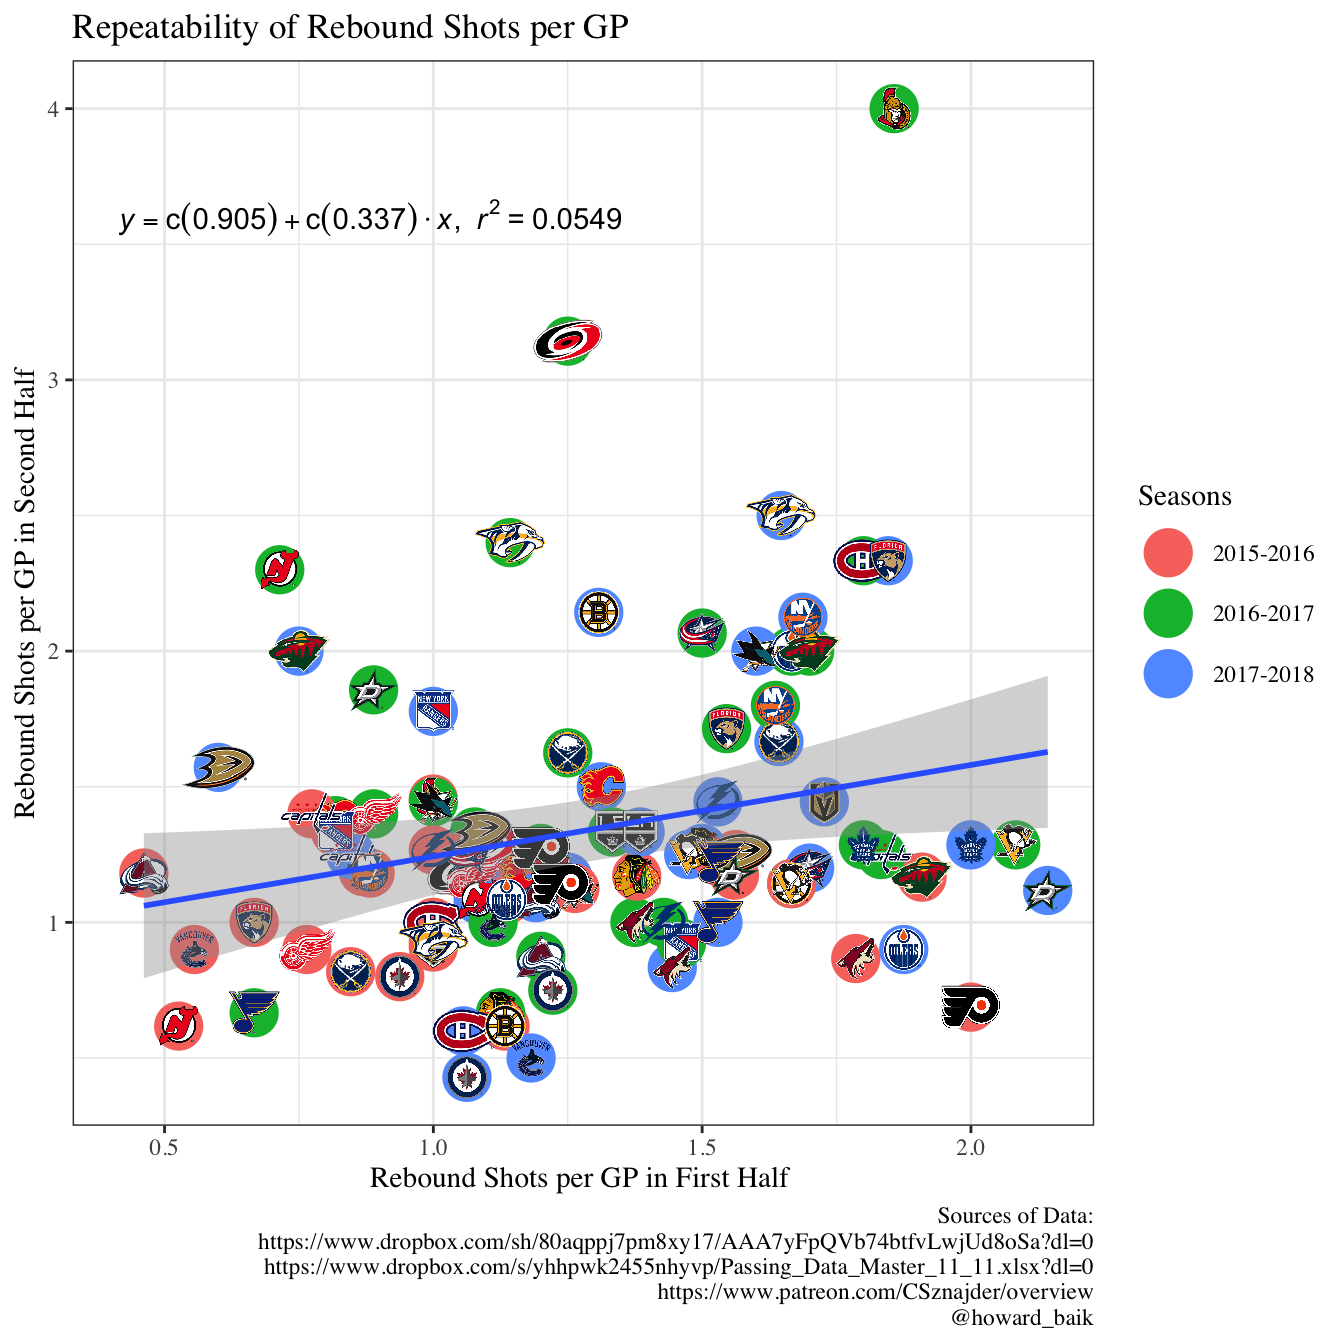
- This graph shows that rebound shots are not repeatable over a given season; there is no significant association between first half and second half rebound shots per GP and any association is minor.
This suggests that rebounds are intrinsically hard to predict over an entire season. Teams face different styles of goaltenders and even different goaltenders if the team plays its backup or AHL goaltender. This graph seems to provide a new perspective, as it contradicts the findings of Schuckers’ 2016 paper: “Statistical Evaluation of Ice Hockey Goaltending”. Using 2009-2010, 2010-2011, 2011-2012, and 2012-2013 data, he suggests that “past rebound rates are not strongly predictive of future rates though they are consistent within a given season.” The above graph illustrates that rebound rates are not “consistent within a given season”.
Repeatability of Rebound Shooting Percentage
`geom_smooth()` using formula 'y ~ x'
- Overall, rebound shooting percentages are not repeatable since I can draw a horizontal line through the confidence band.
- As can be seen in the graph below, the sample size (rebound shot on goal) is small and thus, I caution the reader from drawing a strong conclusion.

Key Takeaways
A team’s rate of odd man rush shots that were preceded by passes is not repeatable within seasons
A team’s rate of shots in other situations that were preceded by passes is repeatable within seasons.
Shooting percentages across the whole season are significantly higher in odd player rushes.
Shooting percentages during odd player rushes and other situations are not repeatable within seasons.
The lane of a primary pass does not lead to a discrepancy in repeatability of shooting percentages.
Rebound shots are not repeatable over a given season. Furthermore, rebound shooting percentages (rebound goals (goals scored from rebounds) divided by rebound shots) are not repeatable.
Conclusion
Hockey is an unpredictable sport. This signifies that a team that may have a horrible record before January 1st still can bounce back to become one of the league’s best teams. Just ask the 2018 Arizona Coyotes. On Dec 31st, the Coyotes were 9-26-5 and were last in the league. “But since Feb. 8, only four NHL teams had more points than Arizona over than span.” The conclusion drawn from this analysis of different offensive statistics helps explain the resurgence of the Arizona Coyotes in the second half.
I would like to thank Sam Ventura for his valuable advice.